

1. Create a Dedicated Demo Hub
Build a separate landing page that serves as a central library for all demos.
This becomes a single destination for:
- Prospects
- Sales teams
- and internal champions
Why centralization matters:
A unified hub simplifies discovery, reduces decision fatigue, and reinforces your position as an organized, buyer-centric vendor.
Demoboost Implementation:
Use Playlists to organize multiple demos within a single gallery page, with a custom navigation sidebar that lets visitors browse by category.
2. Choose the Right Structure
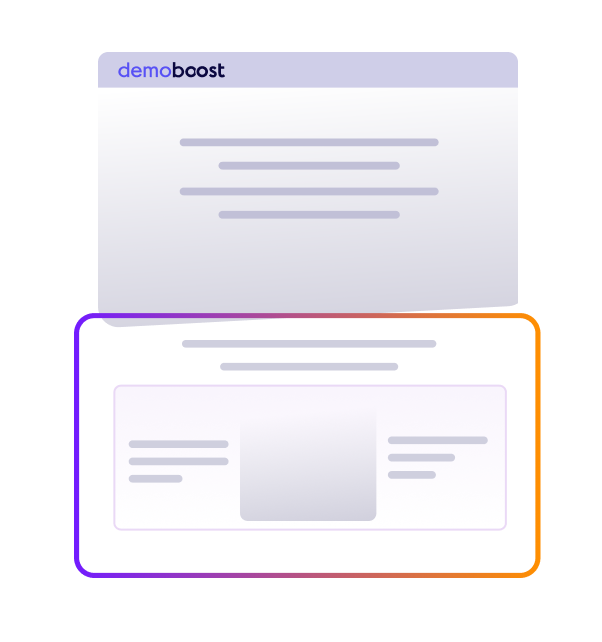
Multi-Layer Structure (for complex or horizontal products)
Best for: Platforms serving multiple industries, personas, or workflows
Example hierarchy
Industry
Level 1: Choose your industry (e.g., Healthcare, Financial Services, SaaS)
Persona
Level 2: Choose your role (e.g., Sales Leader, CS Manager, IT Admin)
Use Case
Level 3: Explore use cases (e.g., Onboarding Automation, Pipeline Management)
This structure prevents cognitive overload and guides buyers through a tailored discovery path.
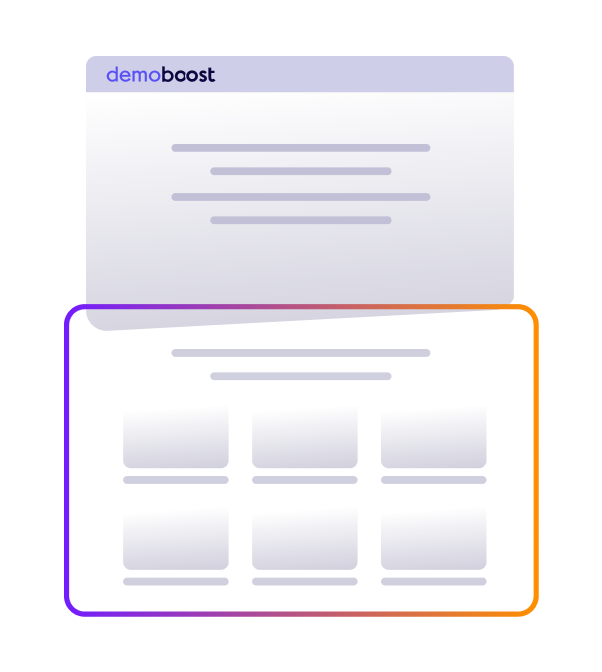
Single-Page Structure (for focused products)
Best for: Point solutions or products with 3-8 clear use cases
Display all demos on one scrollable page, organized by clear category headers. Visitors can scan options quickly and jump directly to what's relevant.
Demoboost Implementation:
Multi-layer: Use Choose Your Own Journey entry screens at each level to create branching paths. Single-page: Build a Playlist with visible navigation that acts as a table of contents
3. Organize by Buyer Logic
Structure your gallery around how buyers think about their problems, not how your engineering team organizes features.
Effective organizing principles
- By Industry – Show how your solution solves sector-specific problems.
- By Persona – Address different roles (e.g. Marketing, Presales, Sales).
- By Use Case – Demonstrate concrete business outcomes.
- By Buyer Journey Stage – Segment demos for different evaluation phases.
4. Design Each Demo to Answer One Core Question
Each demo should be built around a single buyer problem
- What problem does this solve?
- How does it work?
- What outcome does it deliver?
Avoid feature tours. Focus on relevance and value.
5. Keep Visual and Narrative Consistency
All demos in your gallery should share:
- Consistent design language – Same UI treatment, branding, and visual style
- Parallel narrative structure – Similar story arcs across demos (problem → solution → outcome)
- Aligned messaging – Unified value propositions and terminology
Why this matters
Consistency signals professionalism and makes the experience coherent as buyers explore multiple demos or share them across teams.
Demoboost Implementation:
Use Custom Components to build reusable elements (intros, CTAs, navigation) that maintain consistency across all gallery demos. Apply Variables to personalize while preserving structure.
6. Recommended Demo Flow (per demo)
- Start with a Common Challenge
Describe the problem in the buyer’s own language. - Show the Outcome FirstReveal the end result or benefit before explaining how it works.
- Demonstrate the ProcessWalk through only the critical steps.Tie every action to a business benefit (e.g. time saved, errors reduced)
- Highlight IntegrationsExplain how integrations improve workflows and data flow.
- Summarize the ValueReinforce the key benefits and business impact.
- End with a Clear CTAExamples: Book a meeting, Explore another demo, Share internally
7. Best Practices
Use ungated demos
Let buyers experience value before asking for contact details.
Track engagement signals
Even ungated demos provide behavioral data—track which demos each visitor viewed, completion rates, and path through the gallery.
Use sequential CTAs
Suggest related demos to encourage deeper exploration.
Offer primary and secondary CTAs
For example: Book a meeting or Continue exploring
Try our Add-onsto increase your demos’ engagement and interactivity.
8. Role in the Buyer Journey
At the Awareness stage, the Demo Gallery:
- Accelerates buyer education by providing self-serve access to relevant product experiences
- Enables committee-based buying by giving champions shareable assets for internal distribution
- Filters and qualifies interest through engagement tracking across multiple demos
- Prepares buyers for sales conversations by ensuring they arrive informed and with specific questions
The Demo Gallery transforms passive interest into active evaluation, moving buyers from "learning what you do" to "understanding how you solve my specific problem."
9. Success Metrics (industry patterns)
Engagement
- Gallery entry rate: 30–40%+ of visitors entering the demo gallery.
- Demos viewed per session: 2+ demos per visit signals active evaluation behavior.
- Completion rate (per demo): 40–60%+ for tightly scoped, workflow-focused demos.
Intent
- CTA click-through rate: 15–25%+ for contextual CTAs aligned to the demo path.
- Demo sharing: Internal forwarding to other stakeholders is a strong buying signal (typically 3–5 viewers per shared demo).
- Return visits: Repeat gallery sessions within 30 days indicate growing evaluation intent.
Conversion Impact
- Demo viewers → MQLs: Higher-quality leads than static content due to behavioral qualification.
- Demo viewers → meeting requests: Interactive demos outperform passive assets in driving sales conversations.
- Win-rate lift: Opportunities where buyers engage with demos before sales calls close at higher rates than those without demo engagement.
Demoboost Analytics tracks these signals natively, with visibility into entry points, demo paths, stakeholder engagement, and drop-off points.
10. Common Pitfalls to Avoid
- Too many demos without structure – Choice overload reduces engagement when buyers don’t know where to start.
- Organizing by product architecture – Buyers navigate by problems and outcomes, not internal modules.
- Overly long demos – Engagement drops sharply beyond 3–5 minutes per demo.
- Inconsistent demo quality – One weak demo experience reduces trust in the entire gallery.
- Gating individual demos too early – Friction limits exploration and internal sharing.
- No clear next step – Demos without CTAs stall evaluation instead of advancing it.