
.png)
Learn how presales is evolving and howyour team can stay ahead in atech-driven sales landscape.

A demo that gets delivered flawlessly and produces silence afterward isn't a successful demo. It's an unmeasured one.
Most revenue leaders can tell you their win rate. Few can tell you how many of last quarter's losses were actually caused by the demo. Pull every closed-lost opportunity from the last 90 days and you'll get reason codes like "budget," "timing," or "no decision." What you won't get is an answer to the question that actually matters: did the demo experience move the buyer closer to a decision, or did it quietly stall them out. This article walks through how to calculate that number for your own pipeline, using conversion math, engagement data, and a repeatable audit you can run every quarter.
"Demo delivered" measures activity, not outcome. It tells you a call happened. It says nothing about whether the buyer left that call closer to a decision or further from one.
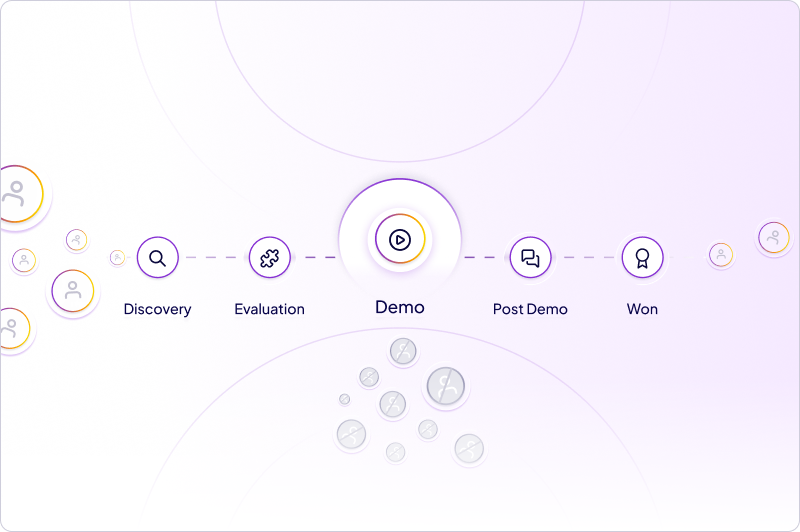
Most presales and sales teams still report demos completed per rep, per week, as if delivery were the finish line. It's the midpoint. The more useful measures sit on either side of the demo itself: what happened immediately after it (did the deal advance to the next stage, or did it go quiet), and what happened to it eventually (did it close, and if not, why). A demo that gets delivered flawlessly but produces silence afterward isn't a successful demo. It's an unmeasured one.
Two numbers do most of the work here, and both are calculable from data most teams already have in their CRM.
Demo-to-next-step rate is the percentage of demos after which the opportunity advanced to the next defined stage within a set window, commonly 14 days. This is the earliest signal that a demo landed. Track it stage by stage, not just demo-to-close, because a demo can succeed at moving a deal forward and still lose later for unrelated reasons.
Demo-to-next-step rate = (opportunities that advanced within 14 days of demo) ÷ (total demos delivered in period)Demo-to-win rate is the percentage of demos that eventually result in closed-won, regardless of how many stages sit between the demo and the close. It's the lagging measure. Useful, but on its own it hides where in the process things actually broke down, which is why it should always be read alongside demo-to-next-step, never instead of it.
Demo-to-win rate = (closed-won opportunities that included a demo) ÷ (total demos delivered in period)Run both numbers by segment (SMB, mid-market, enterprise) and by demo type (live, sandbox, self-guided), not just as a single blended figure. A blended number can look healthy while hiding a segment or format that's quietly underperforming.
This distinction changes what you fix. A competitive loss means the buyer made a decision and it wasn't you. A no-decision loss means the buyer never reached a decision at all.
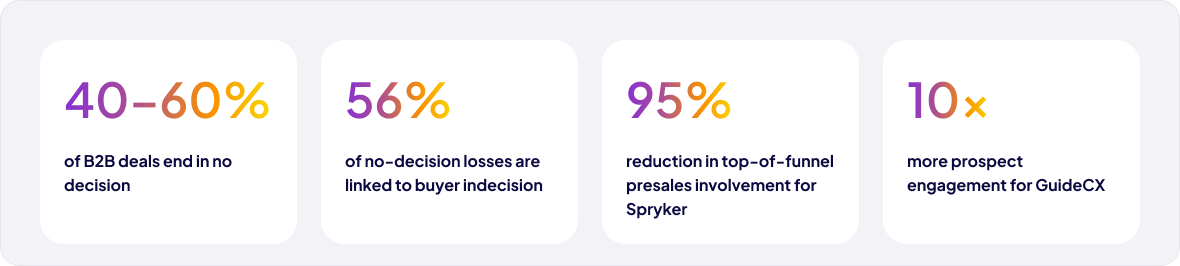
Research by Matthew Dixon and Ted McKenna, published in Harvard Business Review and expanded into their book The JOLT Effect (2022), analyzed roughly 2.5 million sales conversations and found that between 40% and 60% of deals end up stalled in no-decision limbo rather than lost to a named competitor. Within that group, their research splits the cause 44% status quo bias (the buyer decided the current way of doing things was safer than change) and 56% buyer indecision (the buyer wanted to move forward but couldn't resolve enough uncertainty to commit).
The fix depends entirely on which category a deal actually falls into. Most CRMs collapse all three into a handful of generic reason codes, which is exactly what makes this table worth running by hand once a quarter.
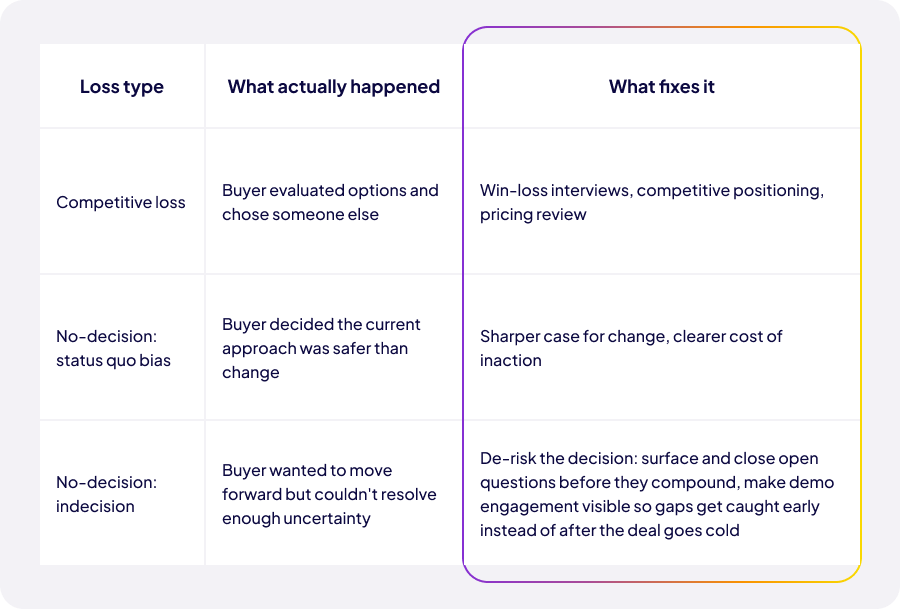
The indecision category is the one a demo process can most directly influence. A buyer who leaves a demo with unresolved questions about fit, implementation, or internal buy-in is statistically more likely to freeze than to actively choose a competitor. If your closed-lost data is dominated by generic reason codes like "no budget" or "went quiet," pull a sample and re-classify by hand using the three rows above. Most teams find the second and third rows are underrepresented in their CRM relative to how often they actually happen, because "no decision" tends to get lumped into whatever reason code was closest at hand when the opportunity was closed out.
Not every stalled deal is a demo problem. But a few patterns show up often enough in post-mortems to be worth watching on every open deal, not just the ones that already died.
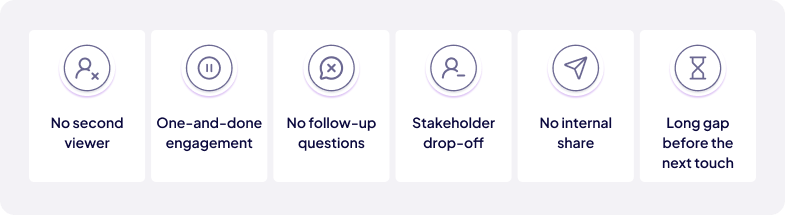
None of these alone confirms the demo caused the loss. Together, especially across several deals in the same quarter, they're a pattern worth investigating rather than a coincidence worth ignoring.
Everything in the warning-signs list above is guesswork without engagement data. This is where demo analytics stops being a nice-to-have and becomes the difference between knowing what happened and assuming it.
At the step level, engagement data can show which stakeholders viewed which parts of a demo, how long they spent, whether they returned, and which sections they skipped entirely. That turns a vague sense that "the buyer seemed interested" into something specific: the economic buyer spent four minutes on the pricing and ROI section and never opened it again, while the technical evaluator returned to the security section three separate times. That's a different conversation to have with the champion than a generic check-in email.
GuideCX saw this play out at scale: connecting buyers to trackable demo experiences drove 10x more prospect engagement and 35,000+ monthly demo views (Chris Haleua, VP of Product and Marketing, GuideCX customer story), which is the kind of visibility that turns a hunch about buyer interest into something a rep can act on before a deal goes quiet, not after.
Step-level engagement data reaches sales and RevOps through Demoboost's Global Webhooks, which send demo events (demo created, demo completed, lead form completed) to Zapier, Make, or Workato, and from there into CRM tools like Salesforce or HubSpot, Slack, or your sales engagement platform. This isn't a native sync. It's a configurable workflow your team sets up once, and it flags a stall while the deal is still open, which is the point where a rep can still act on it.
This is the number that turns "we might be losing some deals to a weak demo process" into a figure a CFO will sit up for. The math is simple by design, so it can be run with numbers you already have.
Annual revenue impact = average deal ACV × 12For example, if your average ACV is $30,000, one additional won deal per month is worth $360,000 in new annual contract value over a year, before accounting for expansion or renewal on top of it. If your product carries meaningful net revenue retention, the lifetime value of that one deal is materially higher than the first-year number alone.
This is the efficiency side of the same question, not the win-rate side: what does a weak demo process cost you in SE capacity, separate from what it costs you in closed deals.
Spryker cut presales involvement in top-of-funnel calls by 95% after moving early-stage demos to a self-service, always-ready format (Edmund Frey, CRO, and Karl Bischoff, Team Lead, Spryker customer story). That's the shape of the calculation below: SE hours that don't have to go to the first call at all.
Presales capacity calculator — inputs (yours, not ours):
Output:
A related but separate question: not fewer top-of-funnel calls, but removing presales from a whole segment.
ELMO Software's SMB team now closes 100% of its deals without presales support (Marcin Wilinski, VP of Revenue Operations, ELMO Software customer story) — a full-segment version of the same efficiency question, not a partial one.
AE-independent SMB calculator inputs (yours, not ours):
Output:
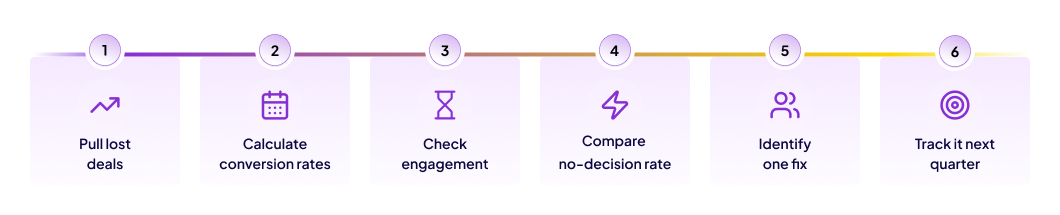
A short, repeatable audit beats an occasional deep dive. Run this once a quarter, ideally the same week each time so the numbers are comparable period over period.
The same logic applies to where you focus effort in the first place. Once you know which deal patterns actually convert, that's where the next quarter's presales and follow-up time should go, not spread evenly across every open opportunity regardless of its odds.
1. What is a no-decision loss, and how is it different from a competitive loss?
A no-decision loss is a deal where the buyer never made a purchase decision in either direction — they didn't choose a competitor and didn't consciously choose the status quo, the deal simply stalled and went inactive. A competitive loss means the buyer evaluated options and picked someone else. Research from Dixon and McKenna (Harvard Business Review, 2022) puts no-decision losses at 40 to 60% of B2B pipeline, meaning they typically outnumber competitive losses by a wide margin.
2. What is demo-to-next-step conversion, and why track it separately from demo-to-win?
Demo-to-next-step is the percentage of demos after which the opportunity advanced to the next defined pipeline stage, commonly within 14 days — the earliest available signal that a demo moved a deal forward. Demo-to-win only shows up much later and, on its own, hides where in the process a deal actually stalled. A demo can succeed at advancing a deal and still lose weeks later for unrelated reasons, so tracking both gives a clearer read on the demo's actual contribution.
3. How does Demoboost help identify which demos contributed to a lost deal?
Demo analytics tracks engagement at the step level: which stakeholders viewed which parts of a demo, how long they spent, whether they returned, and where they dropped off. Connected through Global Webhooks to your CRM and sales tools, that data flags a stalling deal while it's still open instead of only explaining the loss after the fact. [Confirm before publish: if Revenue Intelligence is live and named by publish date, this answer can reference lead-level highlights — drop-off screen, share screen, activity timeline — by name.]
4. What engagement signals indicate a deal is at risk of going to no decision?
A single stakeholder viewing the demo once and never returning, no internal sharing to other stakeholders, drop-off before reaching role-relevant sections, and a long gap before the next scheduled touchpoint are the most common warning signs, though none alone confirms a deal is at risk.
5. Can a demo cause a loss even if the buyer liked it?
Yes. A buyer can rate a demo positively and still stall, particularly in the indecision category of no-decision losses, where the barrier isn't dissatisfaction but unresolved uncertainty about implementation, internal buy-in, or risk. A demo that doesn't proactively resolve those questions can still contribute to a stall even when the immediate reaction is favorable.
6. How often should a demo performance audit be run?
Quarterly is the recommended cadence: frequent enough to catch a rising no-decision rate before it compounds across multiple quarters, infrequent enough to be sustainable without becoming its own overhead.
7. How much revenue does one additional won deal per month represent?
Roughly, average deal ACV multiplied by 12 for the annual new-business impact, before accounting for expansion or renewal revenue on top of it. The exact figure depends on your own ACV and retention numbers.
8. Does a rising no-decision rate show up in the win rate right away?
Not immediately, which is what makes it dangerous. A stalling deal doesn't usually get marked closed-lost right away — it sits open, ages, and only shows up in the numbers once it's finally closed out, often a full quarter or more after the actual stall began. Watching the no-decision rate specifically, rather than just the win rate, catches the problem earlier.
Book a live demo to see how Demoboost helps your team cut demo prep time, qualify buyers faster, and focus on real opportunities.
Book a Live Demo

.png)
.png)
