
.png)
Learn how presales is evolving and howyour team can stay ahead in atech-driven sales landscape.

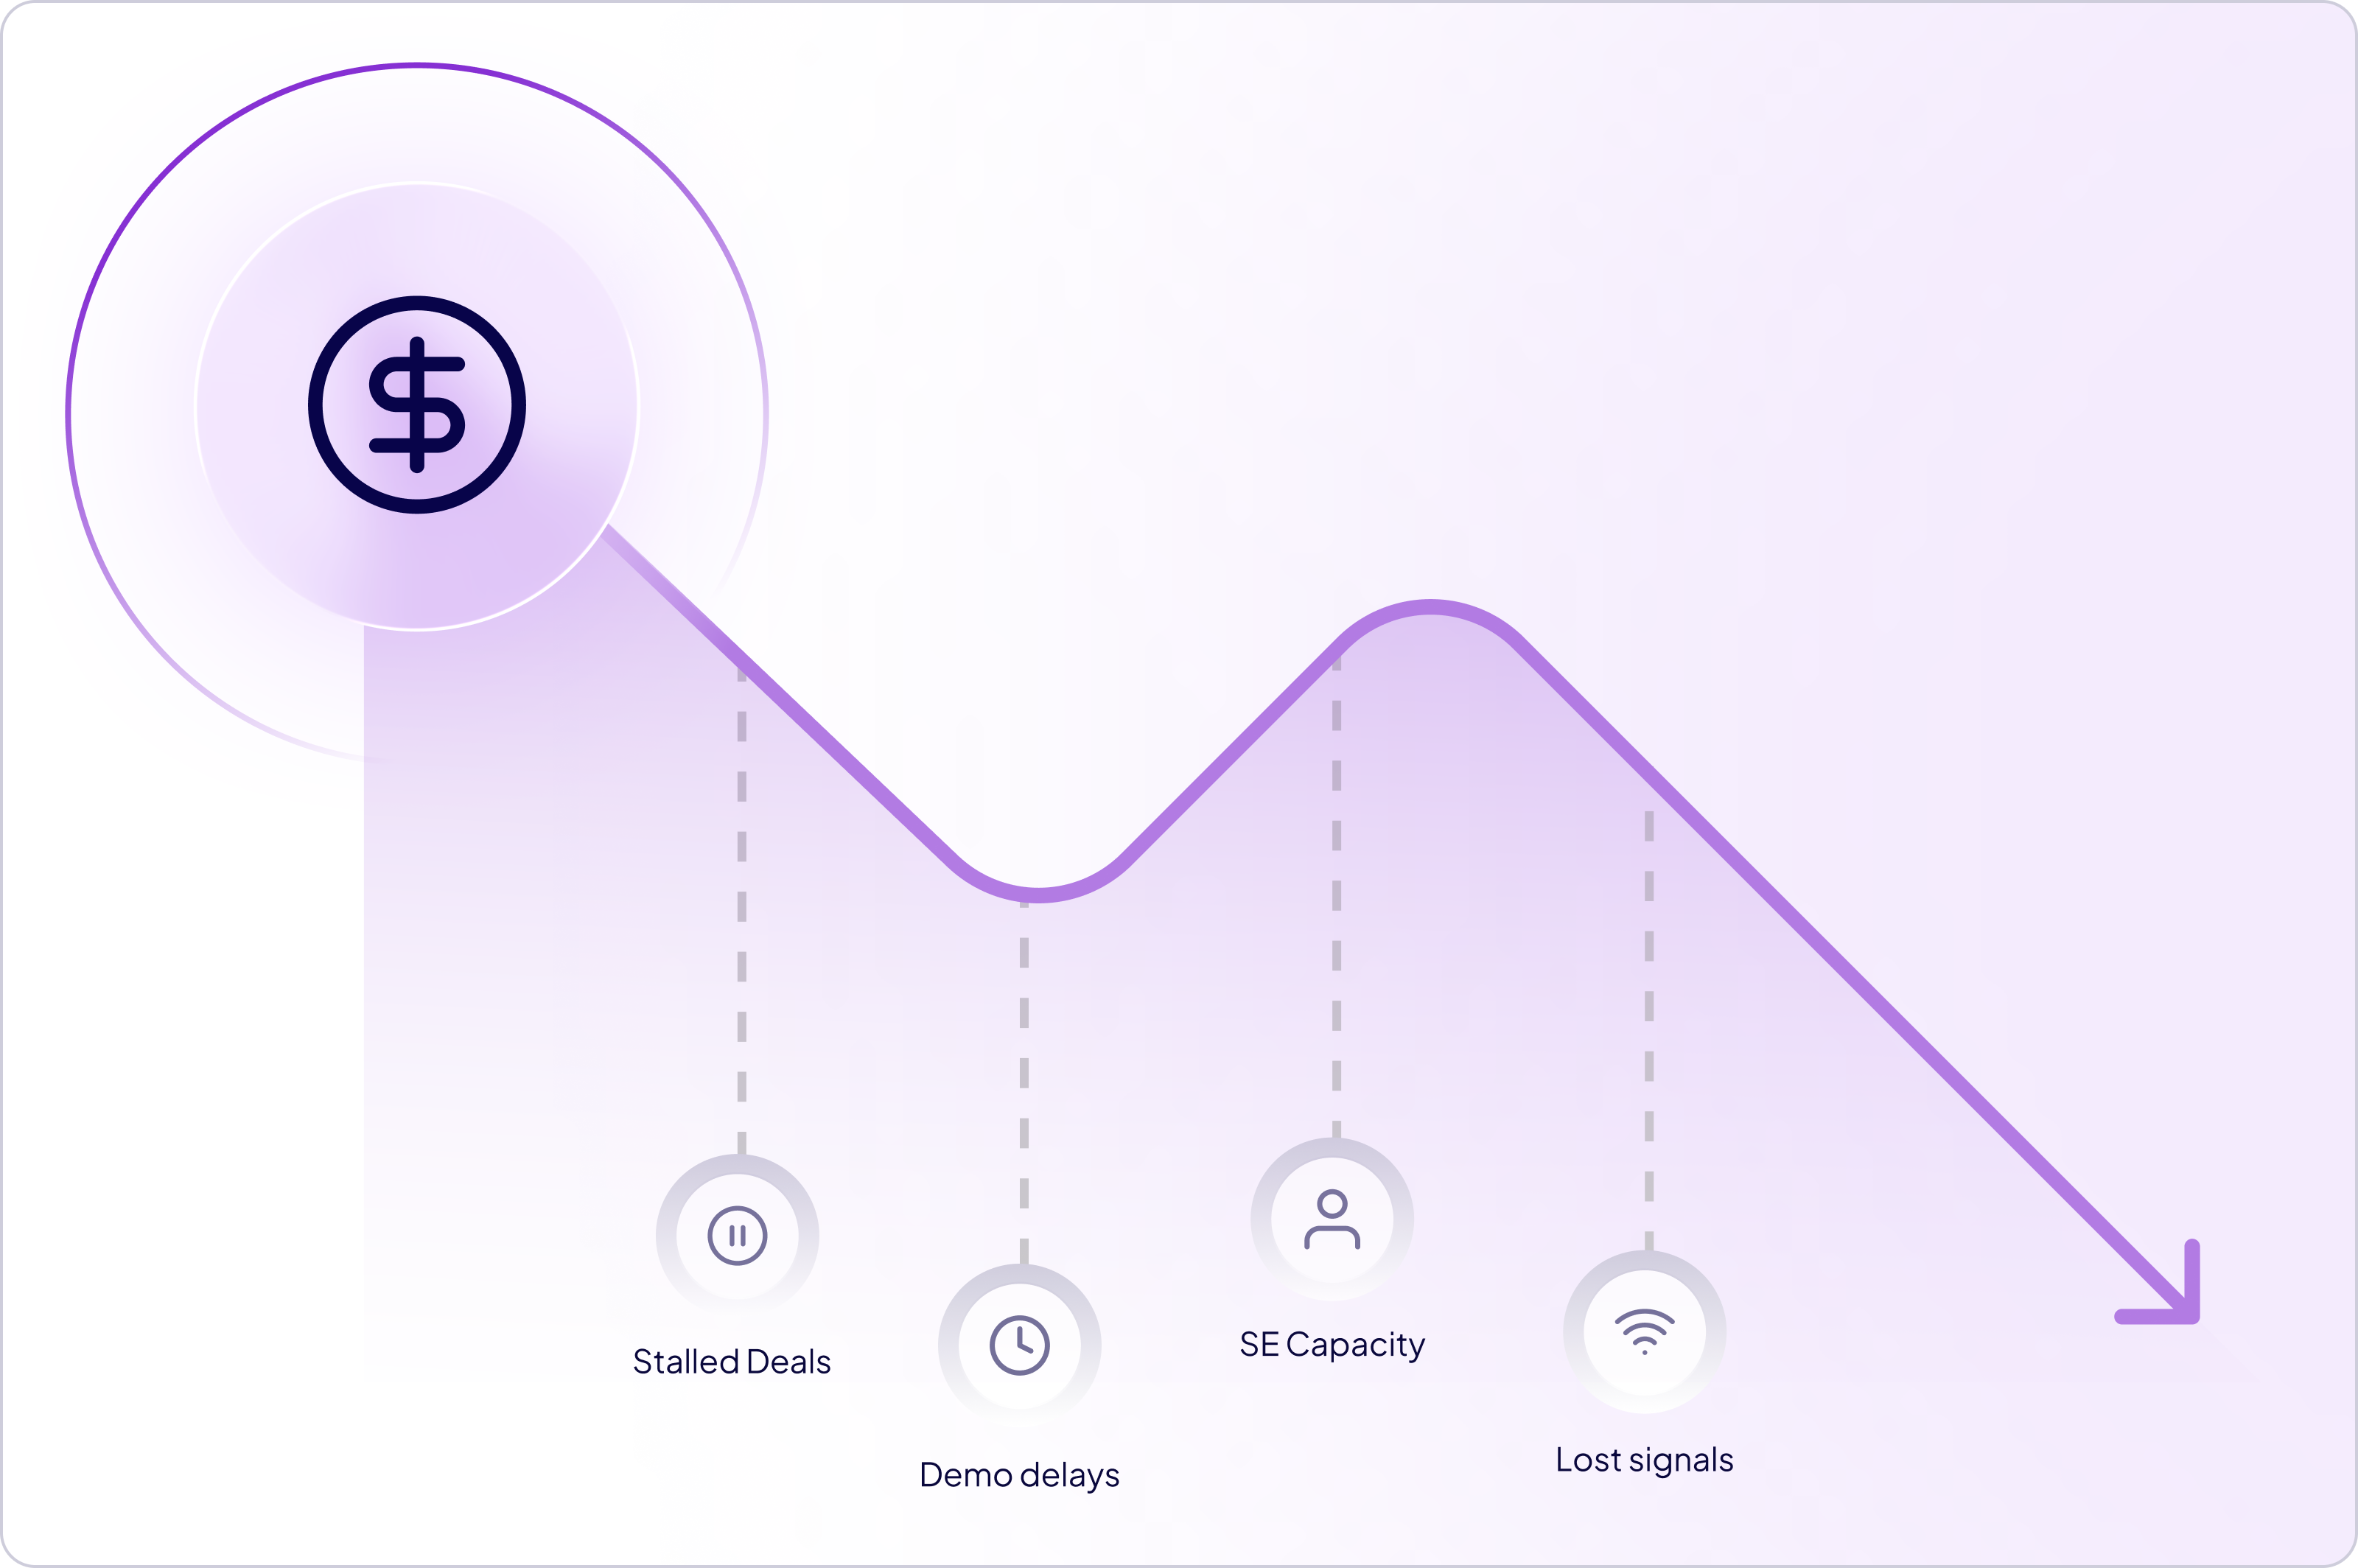
Most revenue leaders can tell you their win rate. Few can tell you the cost of doing nothing about the demo process feeding it. That cost is the revenue that disappears before a deal ever reaches a win or loss column: deals that stall because the buyer never got a clear enough answer to defend internally, demos that arrive too late to matter, and solution engineers (SEs) stretched thin enough that quality drops on every call they take. None of it appears as a line item. It shows up as a lower win rate, a longer sales cycle, and a presales team quietly burning through its capacity.
This article breaks down where that cost sits across the demo motion, what named research says about each leak, and how to put a defensible number on it for your own pipeline.
A demo process leaks revenue in four places: deals that stall without a decision, buyers who wait too long to see the product, SE hours spent on work that does not need an SE, and demo engagement that never reaches the revenue stack. The table below sets out what named research says about each.
The table is deliberately narrow. Several widely repeated demo statistics (no-show rates, share of demos delivered to unqualified leads) circulate without a traceable source, and we do not publish numbers we cannot point you to.
More than most revenue teams assume, because it does not look like a loss. A deal that goes quiet is never marked lost to a named competitor. It simply stops moving.
A demo is one of the few moments in the process where a seller can influence that internal argument, but only if the buyer leaves with something concrete to bring back to the room. A generic walkthrough gives a champion nothing to forward. A demo built around their use case, with their role and their data reflected in it, gives them something to defend a decision with. That difference lands exactly where no-decision losses live: in the gap between "we liked it" and "we're buying it."
Verdict: no decision is not a competitive problem. It is a clarity and urgency problem, and the demo is one of the few assets built to solve it.
It costs you the difference between a buyer at peak intent and the same buyer a week later. Every day between "request a demo" and "see the product" is a day of decaying interest, and it is one of the few funnel metrics most teams never instrument.
Spryker is the clearest illustration. Before switching to demo automation, Spryker's buyers waited an average of 1.5 weeks for a demo. After, the wait was 0 days, and 100% of first calls now include a product demo (Demoboost customer story, 2026). That change also removed 95% of presales involvement in top-of-funnel calls, which means the speed gain did not come at the cost of SE hours. It came from removing SE availability as a dependency in the first place.
This is an infrastructure problem, not a sales skill problem. If the only route to seeing the product runs through a calendar and a specific person's availability, some portion of that pipeline will always cool before anyone gets on a call.
Verdict: time-to-demo is one of the highest-leverage and lowest-effort metrics a revenue team can start tracking this quarter.
It costs roughly a quarter of your presales capacity. Sales engineers spend 26% of their working week on product demonstrations, including preparation and follow-up (Vivun, State of Sales Engineering, 2025, n=110). That is not wasted time by definition, but a meaningful share of it goes to demos that are repeatable, predictable, and identical across deals.
The cost compounds. Repeatable demo load absorbs hours that should go to technical validation on complex deals. It concentrates repetitive work on senior, expensive people, which is a retention problem waiting to be scheduled. And replacing an experienced SE is slow: the new SE ramp runs 4 to 6 months, measured by time to the first prospect demo (Vivun, 2025). Hiring your way out of a demo bottleneck means paying for capacity that does not arrive for two quarters.
Celonis shows the other path. After building a scripted demo library their account executives could run alone, 100% of AEs were always ready to demo, 100% of first calls included a demo, and value engineers were removed from top-of-funnel calls entirely (Demoboost customer story, 2026).
Verdict: the fix for demo load is not more SEs. It is removing the demos that never needed an SE from their calendars.
It costs you the translation work, and the buyer is the one paying it. A one-size-fits-all demo asks the prospect to imagine how a screen full of someone else's data and someone else's use case maps to their situation. Most will not bother.
Speed and personalization are measurable levers on seller productivity. <cite index="10-1">Bain and Company found that sellers may spend only about 25% of their time actually selling to customers, and that AI-driven conversion improvements at every step of the selling funnel add up to more than a 30% increase in win rates (Bain and Company, Technology Report, 2025).</cite> Note the mechanism: the gain comes from both freeing up selling time and improving conversion, not from time savings alone.
On the prep side, Voucherify cut demo preparation time by 80%, from around 3 hours to around 30 minutes (Demoboost customer story, 2026). That is the difference between personalization being a nice intention and personalization being the default, because the version that takes 30 minutes actually gets done.
Verdict: a generic demo does not just underperform. It adds friction at the exact moment the buyer needs clarity.
In most organizations, nothing, and that is the fourth leak. The demo ends, the recording sits in a folder, and sales finds out what the buyer engaged with only if the rep wrote it up. Every signal about which screens held attention, what got skipped, and who else the demo was shared with is lost at exactly the moment it would be most useful.
This is where demo automation stops being a production tool and becomes a demo revenue system. Demo analytics shows how buyers engaged with a demo, including which steps they viewed, where they spent time, what they skipped, and whether they returned. Demo Tags let teams label demos so that engagement can be grouped by use case, persona, or campaign rather than read one demo at a time.
Getting that signal into the systems your revenue team already works in runs through Global Webhooks. Demoboost sends demo events to middleware such as Zapier, Make, or Workato, which routes them into your CRM, Slack, Microsoft Teams, sales engagement platforms, and marketing automation. Three triggers are live today: demo created, demo completed, and lead form completed. Demoboost's built-in connections also cover lead and opportunity creation from demo interactions, form fill capture into CRM, and the marketing and analytics tools listed on the integrations page.
The point is not the plumbing. It is that a demo stops being a meeting that happened and becomes a durable, trackable buying asset that the rest of the revenue stack can act on.
Verdict: a demo that disappears after the call is the cheapest leak on this list to fix and the one most teams never look at.
You do not need a precise model. You need a directional one built from your numbers rather than borrowed benchmarks. Four inputs get you most of the way there.
.png)
Add the four together and you have a conservative, defensible number: revenue currently lost to an unfixed demo process rather than to competitors or market conditions.
Not much headcount, and that is the point. Fixing this means closing four specific gaps rather than scaling the team that absorbs them.
None of this eliminates every leak. It closes the ones currently costing revenue for no reason other than an unfixed process.
Worth being fair to the left column: tracking demo volume is not useless, and it is the right first metric for a team with no demo instrumentation at all. It just stops being informative the moment volume goes up and quality does not.
If more than two are true, the cost described above is not hypothetical. It is already in your numbers, filed under something other than "demo problem."
None of the research here requires a weak product or a difficult market. No-decision losses, buying-committee stalls, and demo load concentrated on senior presales people happen inside otherwise healthy pipelines, because the demo process was never built to prevent them. That is the uncomfortable part of the cost of doing nothing. It is not a risk you are choosing to accept. It is a cost you are already paying.
The fix is not dramatic. Get a demo in front of the right person faster, make sure it is the right demo for their use case, and give sales visibility into what happened afterward. Teams that do this do not win by out-competing rivals. They convert the pipeline that was already there.
1. What is the cost of doing nothing in B2B sales?
It is the revenue lost when a process problem goes unaddressed, not because a competitor won the deal but because the process itself let pipeline leak out through stalled decisions, slow demo delivery, or misallocated presales time. It is calculable even though it never appears as a single line item on a P&L. Most teams underestimate it because no dashboard has a category for it.
2. How many B2B deals end in no decision rather than a competitive loss?
Between 40% and 60% of qualified deals, according to Matthew Dixon and Ted McKenna in Harvard Business Review, based on an analysis of more than 2.5 million recorded sales conversations. That typically makes no decision the largest single category of pipeline loss, larger than losses to any individual competitor. Most CRMs do not track it separately, which is why it goes unmanaged.
3. Why do B2B buying teams stall even when they like the product?
Gartner research finds that 74% of B2B buying teams show unhealthy conflict during the buying decision process. The deal stalls on internal disagreement inside the buying group rather than on a product comparison. A champion who cannot make the case internally will not make it at all, regardless of how well the demo went.
4. How much of a sales engineer's week goes to demo work?
Sales engineers spend 26% of their working week on product demonstrations, including preparation and follow-up, according to Vivun's State of Sales Engineering report (2025, n=110). Not all of that is avoidable. The recoverable portion is the share going to repeatable demos that any trained seller could run with the right demo library.
5. Does hiring more sales engineers fix a demo bottleneck?
Not quickly, and usually not durably. New SE ramp runs 4 to 6 months measured by time to first prospect demo (Vivun, 2025), so added capacity does not arrive for roughly two quarters. Demand also tends to grow back to whatever capacity exists, which means the bottleneck reappears at a higher cost base.
6. How does demo automation reduce time between request and demo?
It removes SE availability as a dependency. Prospects reach a sandbox or self-guided demo at the moment they request one rather than waiting for a calendar slot. Spryker cut demo wait times from an average of 1.5 weeks to 0 days after moving to Demoboost, with 100% of first calls now including a product demo.
7. How is a demo revenue system different from adding another demo tool?
Demo automation tools speed up how a demo gets built. A demo revenue system connects that demo to the rest of the funnel, so engagement data reaches the CRM, seller time follows real intent signals, and the demo remains a reusable asset after the meeting rather than a recording nobody opens. The difference is whether demo activity ever becomes visible to the people forecasting revenue.
8. Can I calculate my own cost of doing nothing before talking to anyone?
Yes. Use the four-input framework above: stalled pipeline value, time-to-demo drag, SE hours on repeatable demo work, and post-demo blind spots. Build it from your own numbers rather than industry averages, since the point of the exercise is a figure you can defend in your own forecast review.
Book a live demo to see how Demoboost helps your team cut demo prep time, qualify buyers faster, and focus on real opportunities.
Book a Live Demo

.png)
.png)
