If this editor looks unfamiliar, you're likely using the previous version.
Access the right documentation by clicking on the button.
Demoboost's Asset Analytics helps you understand how your demos are performing, how viewers engage with them, and which assets drive the strongest buyer interest.
From individual demo visits to screen-level performance and library-wide trends, Asset Analytics gives you the visibility you need to improve demo storytelling, identify high-performing assets, and turn engagement data into better demo experiences.
In this article, you'll learn how to analyze individual demo performance, understand visit and screen engagement, explore library-level analytics, and track performance across demos and playlists.
Step 1: Open Demo Analytics
Once your demo has been shared and starts getting views, open the demo's Details page and navigate to the Analytics tab.
Here, you'll find everything you need to understand how viewers interact with your demo and how effectively it performs over time.
Step 2: Review the Demo Performance Overview
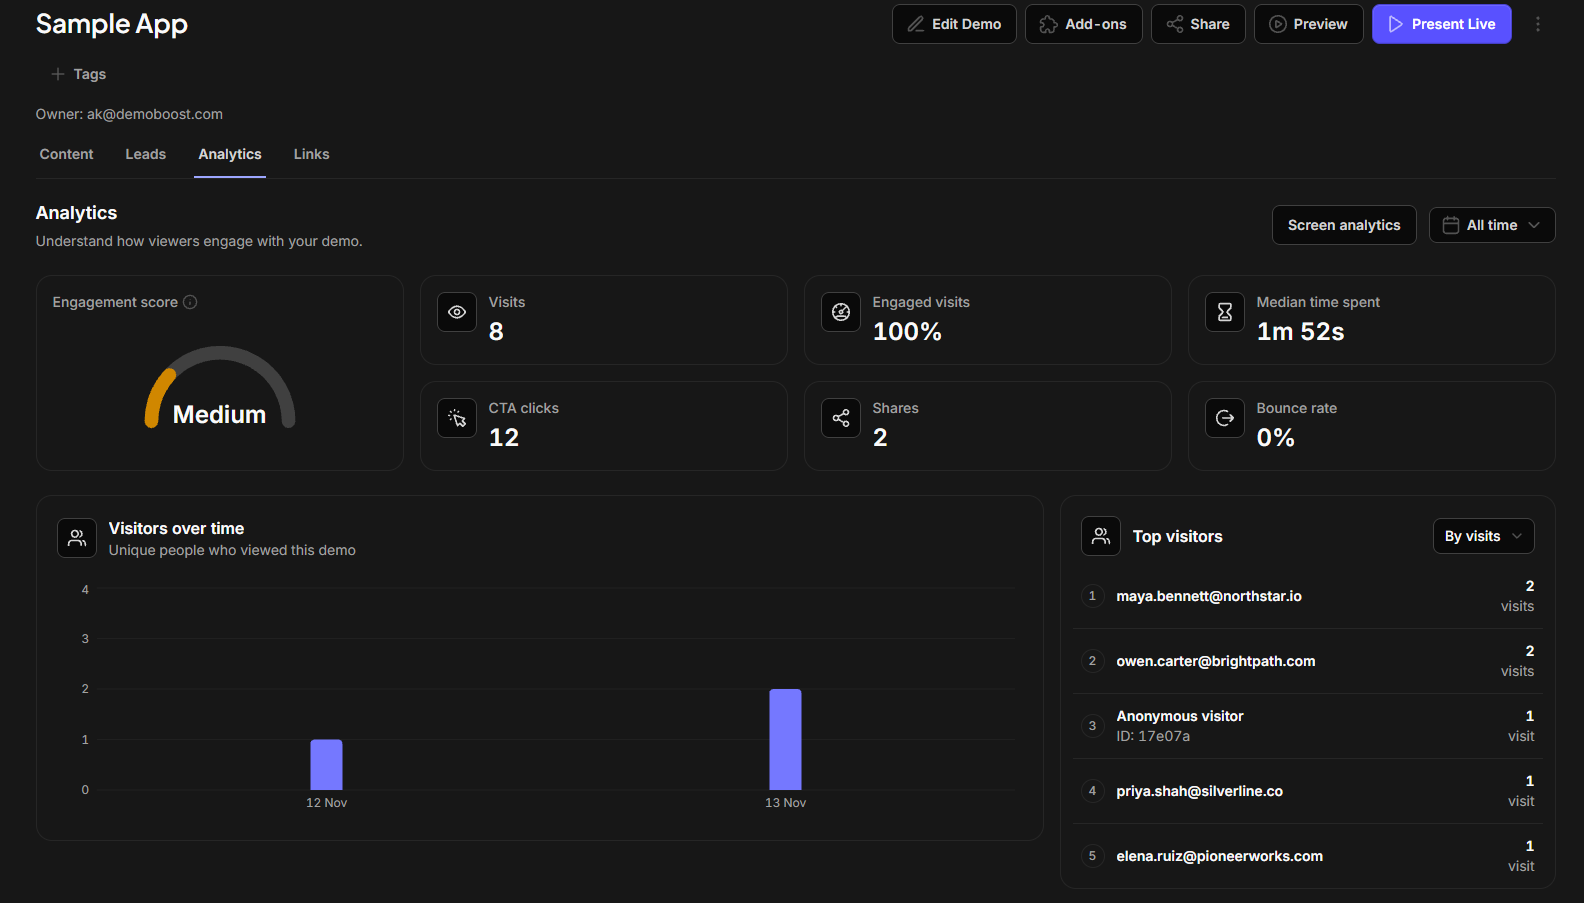
At the top of the Analytics tab, you'll see a summary of key performance metrics for the selected period:
- Visits
- Engaged Visits (visits where the viewer spends at least 30 active seconds and reaches 2 screens, clicks a CTA, shares the demo, or completes it)
- Median Time Spent
- CTA Clicks
- Shares
- Bounce Rate
- Engagement Score
How Visit Engagement Scores Work
Each demo visit earns points based on the viewer's activity.
Based on the total score for a visit, Demoboost classifies visit intent into three levels:
High: 35 points and above
Medium: 20–34.9 points
Low: Below 20 points
A minimum of 5 visits is required to calculate the demo's overall engagement score.
Step 3: Explore Viewer Trends and Top Visitors
The Visitors Over Time chart shows how many unique viewers accessed your demo over time, including anonymous visitors.
The Top Visitors panel highlights the people who engaged with your demo most. Use the dropdown to rank visitors by:
- Number of visits
- Time spent
This helps you quickly identify who is exploring your product most actively.
Step 4: Review Individual Visits
Scroll down to explore the list of individual visits.
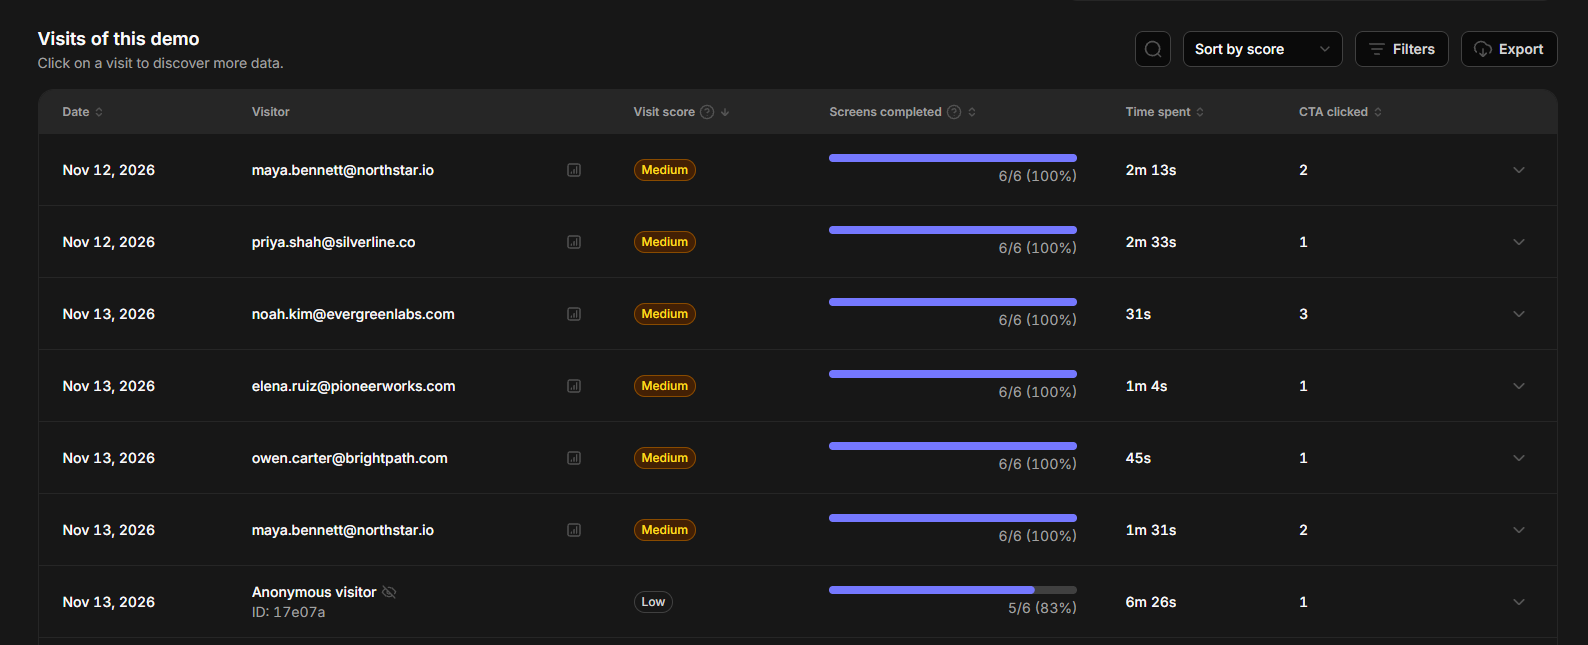
For each session, you can review:
- Visit score
- Screens completed
- Time spent
- CTA activity
If the visitor is identified, click their name to open Lead Analytics and explore their engagement journey in more detail.
Step 5: Filter and Export Visit-Level Analytics
Use Filters to narrow the visitor list and focus on the sessions most relevant to your team.
Click Export to download visit-level demo analytics for further analysis or reporting.
Step 6: Switch to Screen Analytics
Beyond overall demo performance, you can analyze engagement screen by screen.
Switch to Screen Analytics to understand which parts of your demo attract attention and where viewers begin to lose interest.
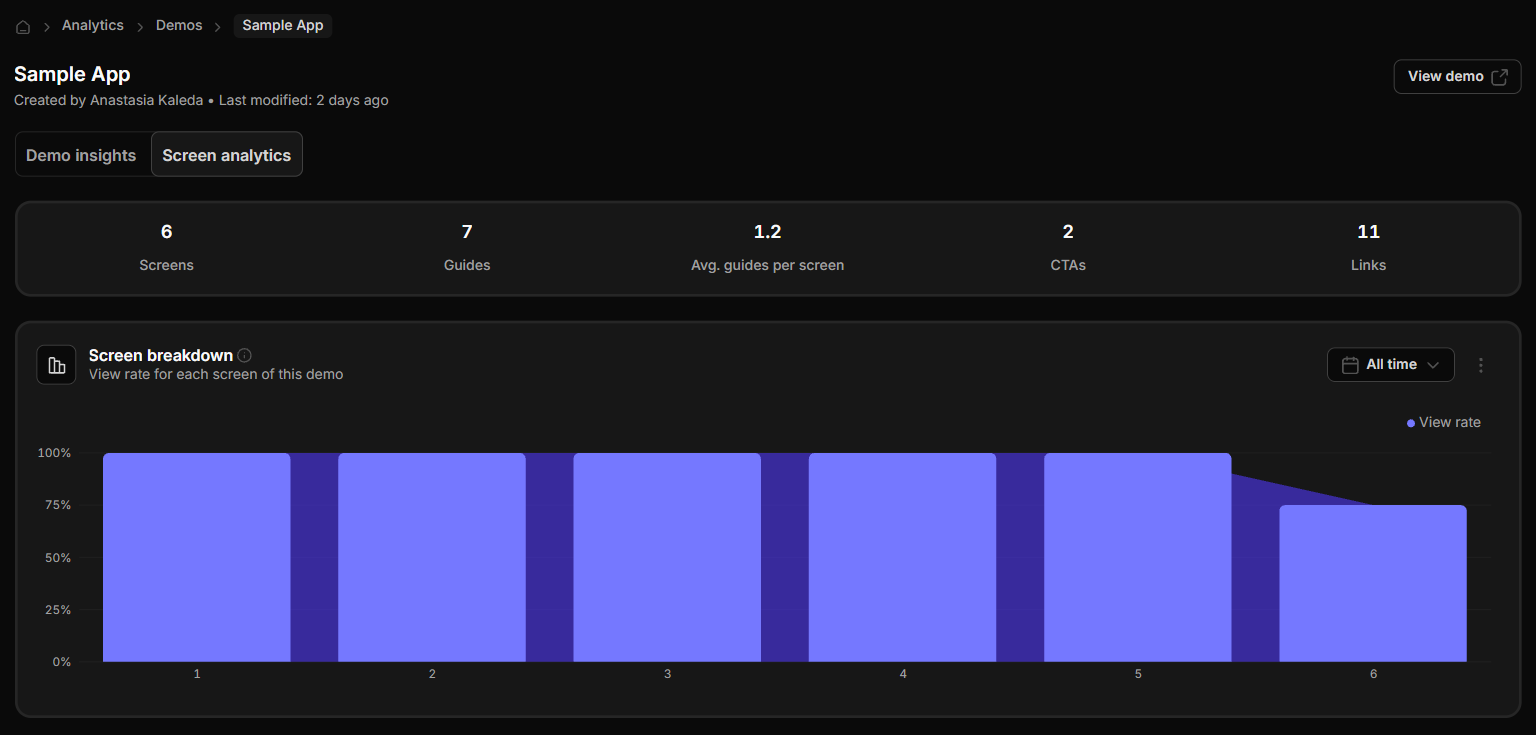
Step 7: Review Screen Performance
At the top of Screen Analytics, you'll see an overview of your demo's structure, including:
- Total Screens
- Guides
- Average Guides per Screen
- CTAs
- Links
These metrics provide context for understanding how your demo's structure may influence engagement.
The Screen Breakdown chart shows the percentage of demo visits that reached each screen.
Below, you'll find a detailed breakdown of every screen, including:
- Engagement score
- Views
- Median time spent
- Shares
- CTA clicks
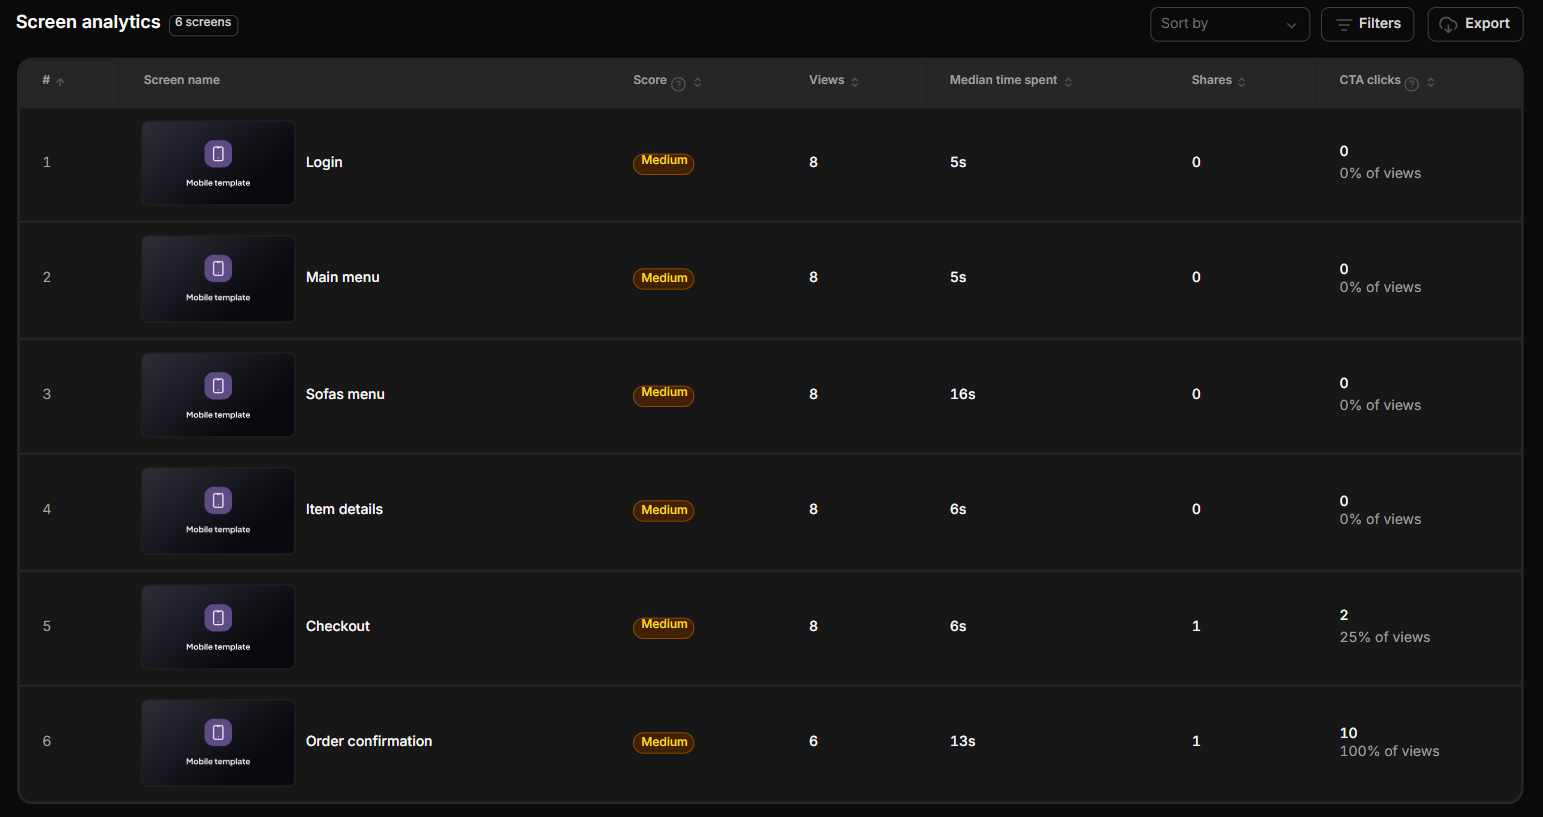
Use these insights to identify which screens resonate with buyers, which drive action, and which could benefit from stronger storytelling or clearer calls to action.
You can also sort and filter screen analytics to focus on specific metrics. Click Export to download the data and share your findings with your team.
Step 8: Open Library-Wide Demo Analytics
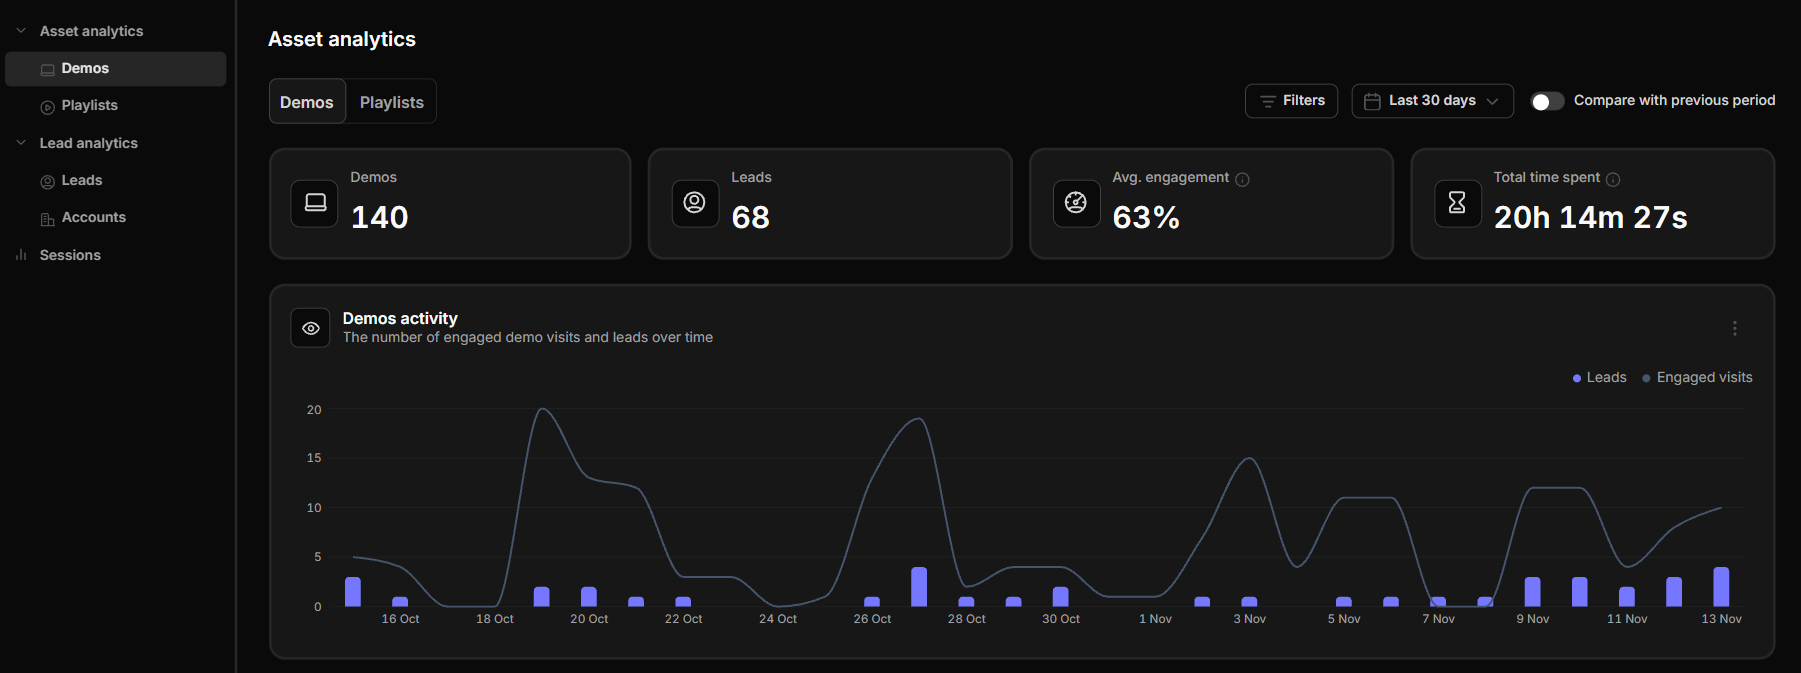
To explore performance across your entire demo library, navigate to Analytics → Demos in the main navigation.
At the top of the page, you'll see four key metrics:
- Demos: Total number of demos in your library.
- Leads: Identified prospects generated.
- Avg. Engagement: Percentage of visits that qualify as engaged.
- Total Time Spent: Combined active viewing time across all demos.
These metrics help you measure how your demo library contributes to buyer education and lead generation.
Note: These analytics cover on-demand activity, not live presentations.
Step 9: Track Demo Activity Over Time
The Demo Activity chart shows:
- Engaged visits over time
- Identified leads over time
Select your preferred timeframe and enable Compare with Previous Period to see how performance has changed.
Use this comparison to identify increases in engagement, spot declining activity, and measure progress over time.
Step 10: Understand the Conversion Funnel
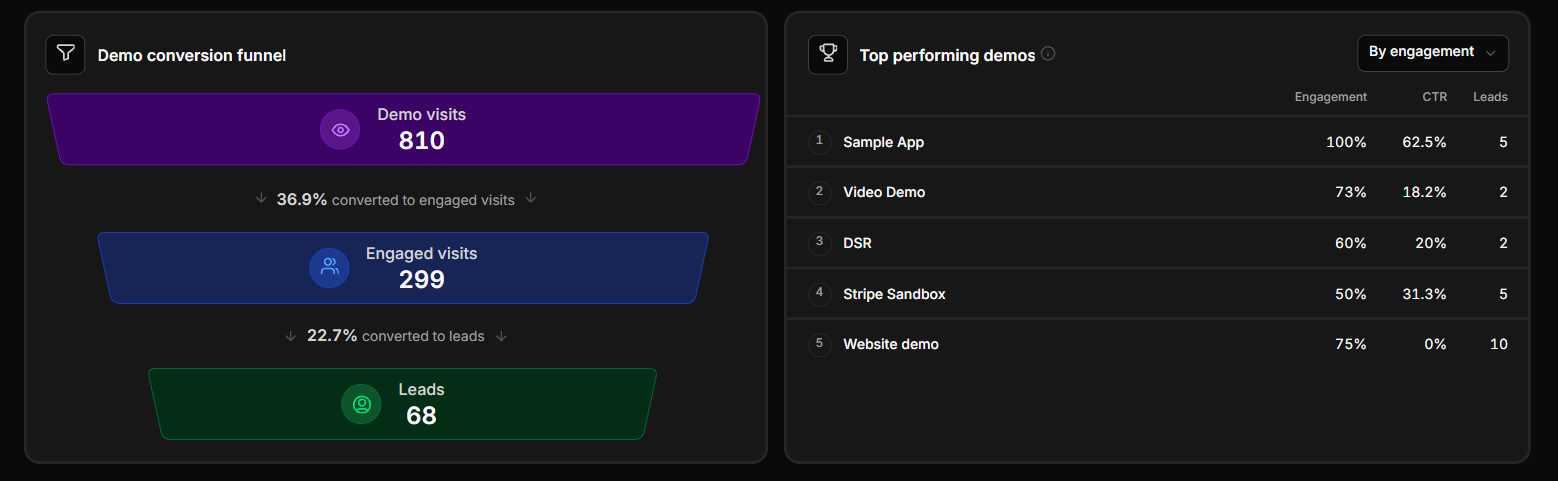
Demoboost shows how viewers progress through three stages of the conversion funnel:
Visits → Engaged Visits → Leads
A Lead is a viewer identified through a lead form or verified sharing link.
Use the funnel to understand how effectively your demos turn visits into meaningful engagement and identified leads.
Step 11: Identify Your Top Performing Demos
The Top Performing Demos panel highlights your strongest assets.
By default, demos are ranked by engagement, but you can use the dropdown to explore rankings by:
- CTA Conversion
- Leads Generated
This helps you identify which demos perform best based on your goals.
Step 12: Review and Compare Your Demo Library
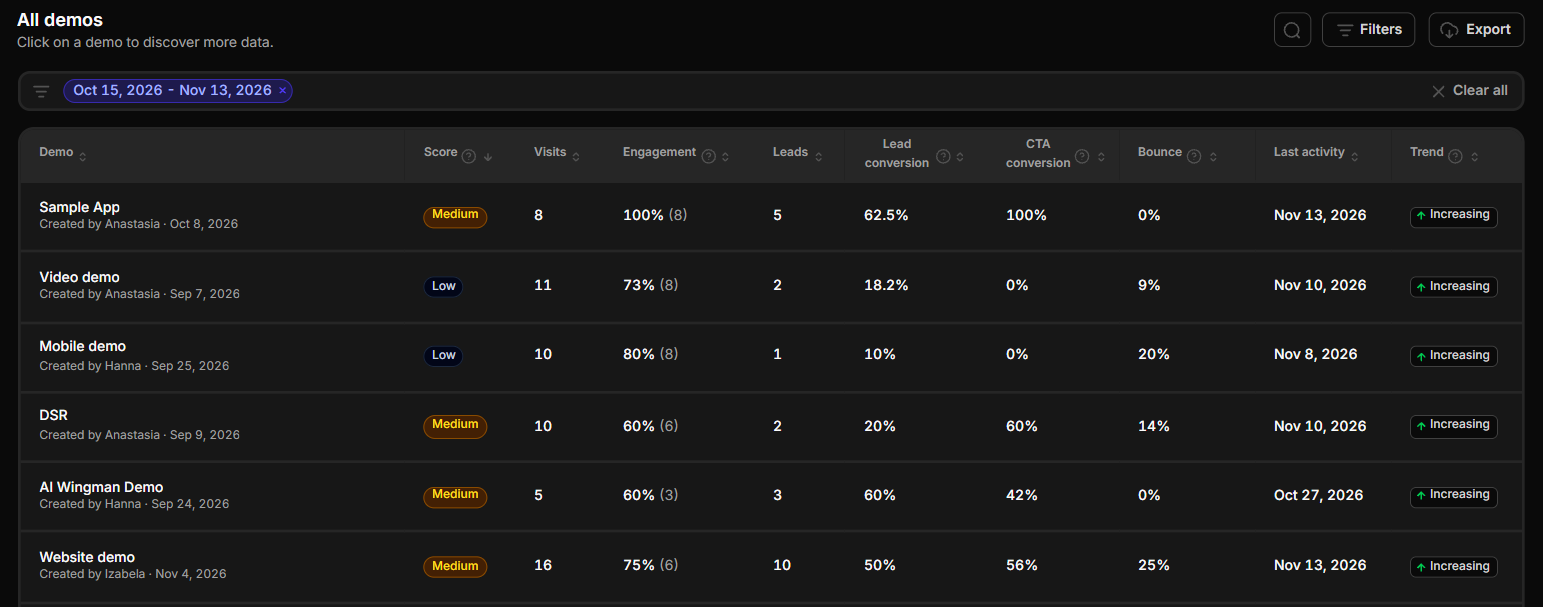
Scroll down to review your demos alongside their performance metrics, including:
- Performance score
- Visits
- Engagement
- Conversions
- Bounce rate
- Trends
Click any demo name to open its detailed analytics and explore performance at a deeper level.
Use filters and sorting options to focus on the metrics most relevant to your goals and identify which demos perform best or may need optimization.
Step 13: Export Demo Library Analytics
Click Export to download your demo library analytics.
You can use this data for reporting, sharing insights with your team, or conducting further analysis outside Demoboost.
Step 14: Explore Playlist Analytics
Switch to the Playlists tab to explore similar analytics across your playlist library.
Here, you can understand how your grouped demo experiences perform and identify opportunities to improve engagement across playlists.
You're All Set! Better Insights, Better Demos
With Demoboost Asset Analytics, you can measure engagement across individual demos, screens, and your entire demo and playlist library.
Use these insights to identify what works, improve underperforming content, and create more engaging product experiences backed by real buyer behavior.